


Related Articles
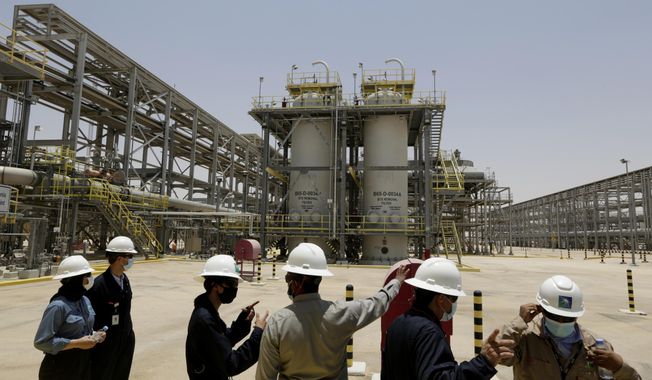
Saudi Arabia pledges 2060 target of net-zero emissions
One of the world's largest oil producers, Saudi Arabia, announced Saturday it aims to reach "net zero" greenhouse gas emissions by 2060, joining more than 100 countries in a global effort to try and curb man-made climate change.

A blurred movie year comes into view at New York Film Fest
A movie year of fits-and-starts, delays and reversals has sometimes been difficult to track. Knowing just where and how a new movie premieres has become a sport of its own. Even for those closely following new films, it's been a sometimes exhilarating, sometimes befuddling half-virtual, half-in-person year of moviegoing.

Democratic congresswomen urge Biden to stop pipeline in Minnesota visit
Minnesota U.S. Rep. Ilhan Omar and her progressive congressional allies urged President Joe Biden on Friday to stop construction on Enbridge Energy's Line 3 replacement, even as the project nears completion and the options to stop it dwindle.
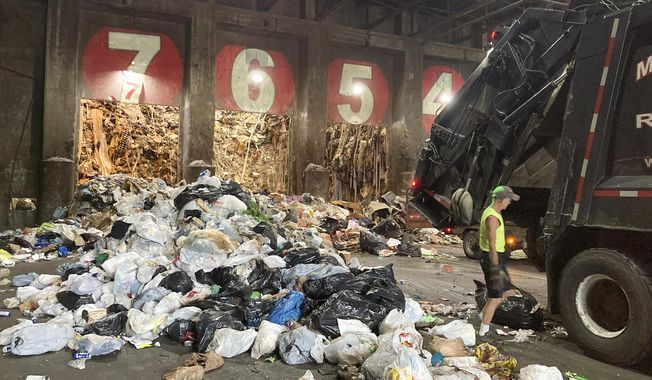
Pandemic garbage boom ignites debate over waste as energy
America remains awash in refuse as new cases of the coronavirus decline - and that has reignited a debate about the sustainability of burning more trash to create energy.

Will Smith picks up tab for New Orleans’ July 4 fireworks
Fireworks are returning to New Orleans on Independence Day thanks to actor Will Smith.
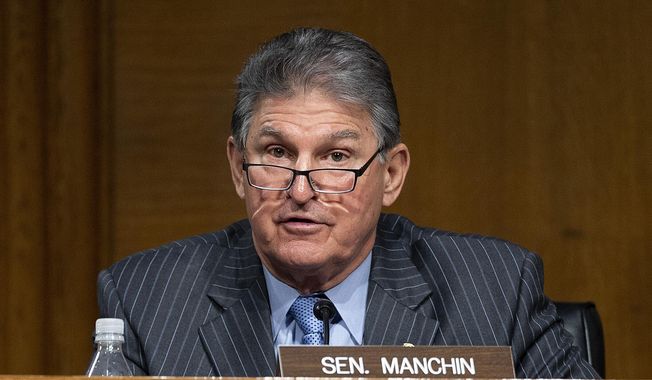
White House woos Manchin, fossil fuel workers with promises of climate-change jobs
The White House is upping its efforts to court Sen. Joe Manchin III, a vital Democratic swing-vote for President Biden's agenda, as bipartisan infrastructure talks stall.

President Biden planning executive actions on guns, White House says
President Biden is preparing executive actions that seek to combat gun violence.

Greece to reopen ancient sites despite COVID-19 surge
Greece's government announced plans Friday to reopen the Acropolis in Athens and other ancient sites nationwide and provide free weekly rapid tests for COVID-19 for all the country's residents as it prepares to restart the tourism season in mid-May.
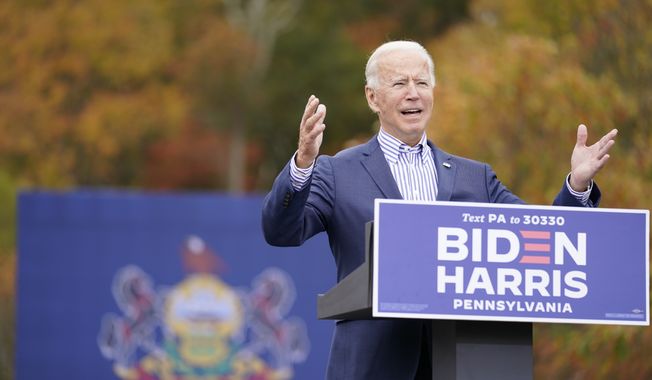
Under fire, Biden vows ‘I am not banning fracking’
Seeking to stop the political bleeding, Joseph R. Biden struck out on the campaign trail Saturday in Pennsylvania, pushing back against President Trump's charge that he wants to bring the hammer down on the oil and gas industry in the state by banning fracking.

Facebook to stop running political ads after Election Day
Facebook said it plans to temporarily stop running political ads in the U.S. after polls close on Election Day next month in order to "reduce opportunities for confusion or abuse" on its platform.

40% of hotel workers out of a job as hospitality industry prepares for nightmarish holiday season
Forty percent of employees in the hotel business remain out-of-work as the coronavirus pandemic and economic shutdowns have hammered the hospitality industry nationwide, according to a new report from the American Hotel and Lodging Association.
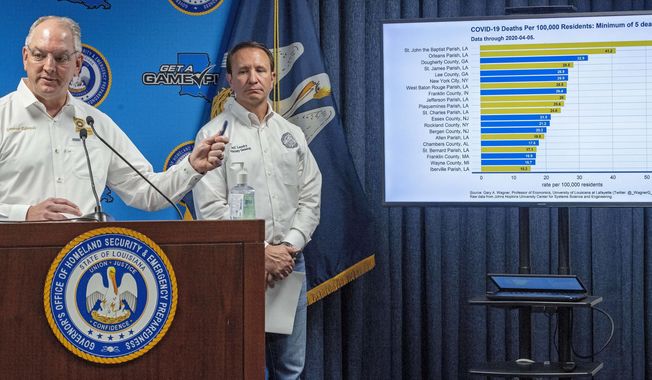
Pharmaceutical company promises drugs for hard-hit Louisiana
A second pharmaceutical company promised more coronavirus fighting drugs Monday to hard-hit Louisiana as the state's death toll attributed to the virus rose to 512.
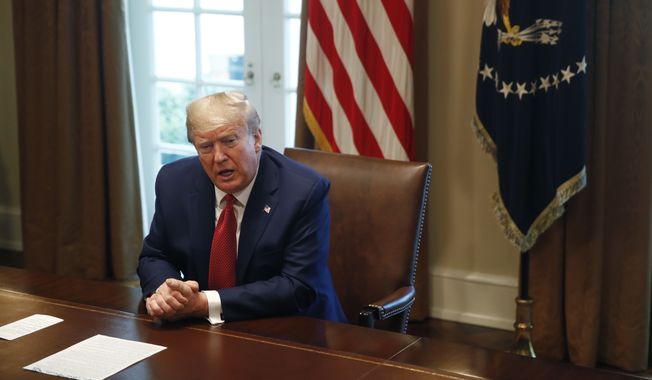
Trump accuses hospitals of ‘hoarding’ ventilators, other needed supplies
President Donald Trump says his administration has identified cases of "hoarding" of medical supplies and equipment by hospitals and medical professionals.

Rasmussen poll: 23% of voters say NRA should be declared a ‘terrorist group’
The National Rifle Association is America's largest gun rights organization with over 5 million members. Nevertheless, San Francisco officials recently voted to declare the organization a "terrorist group" - an idea which has appeal for some Americans, particularly Democrats.
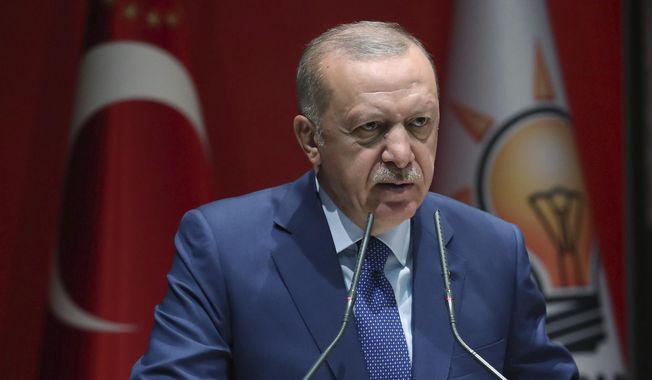
Nukes the latest distraction as Erdogan clings to power
Dictators throughout history have played the same games in order to stay in power. One stratagem is as old as Rome itself, after the republic became corrupt and gave way to an empire run by one man, rather than the Senate.
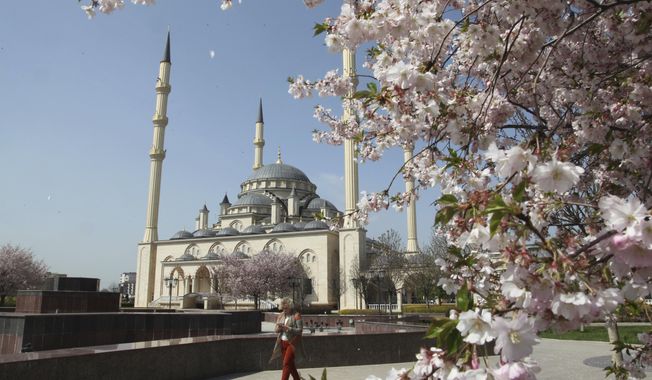
An eye-opening, first-hand view of Chechnya today
I have to admit I was hesitant when asked to participate in a 10-day "cultural tour" of Chechnya in the northern Caucasus.

Stephen Landes pleads guilty in ‘swatting’ Delaware Walmart, school
A New Mexico man has pleaded guilty to making interstate bomb threats against an elementary school and a Walmart in southern Delaware

Trump’s realism opens up new possibilities with Russia
President Trump confirmed Thursday he and Russian President Vladimir Putin spoke by phone about the raging fires and about possible technical help the U.S. could offer. Moscow no doubt sees the Trump offer as the start of a pathway for better U.S.-Russia relations.

Saudi think tank closes D.C. offices
The Arabia Foundation was a pro-Saudi think tank in Washington, known for communicating on issues important to the Kingdom to the American audience and their representatives. It abruptly closed this week, leading to speculation as to why.
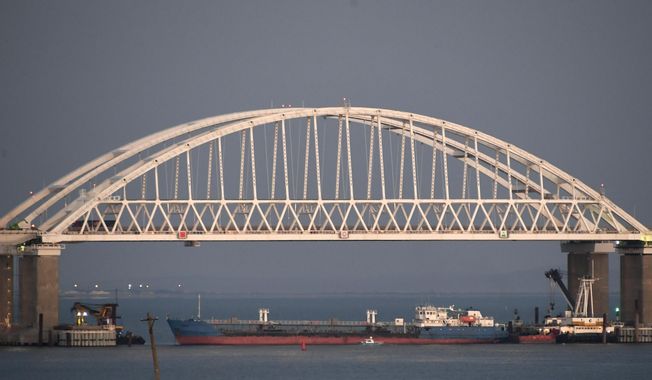
Questions abound over Ukraine’s seizure of Russian tanker
It was a move both obvious and ominous.